Understanding Learner Behavior in Online Courses.
My Role
UX Researcher
Timeline
2 months
Platform
Tableau Public
Project Type
Academic - I-590 Visualizing Data with Tableau
Through the “Online Course Student Engagement Metrics” dataset, I explored key metrics like registration trends, engagement levels, and certification rates. This dataset provided insights into the challenges and opportunities for enhancing learner experiences in online education.
Visualizing Data for Student Engagement Metrics
01
Only 3% of registered learners complete certifications, highlighting significant drop-off rates and low engagement in online courses.
Active learning boosts engagement, doubling course completion rates.
Source
Through the dataset, I explored key metrics like registration trends, engagement levels, and certification rates. This dataset provided insights into the challenges and opportunities for enhancing learner experiences in online education.
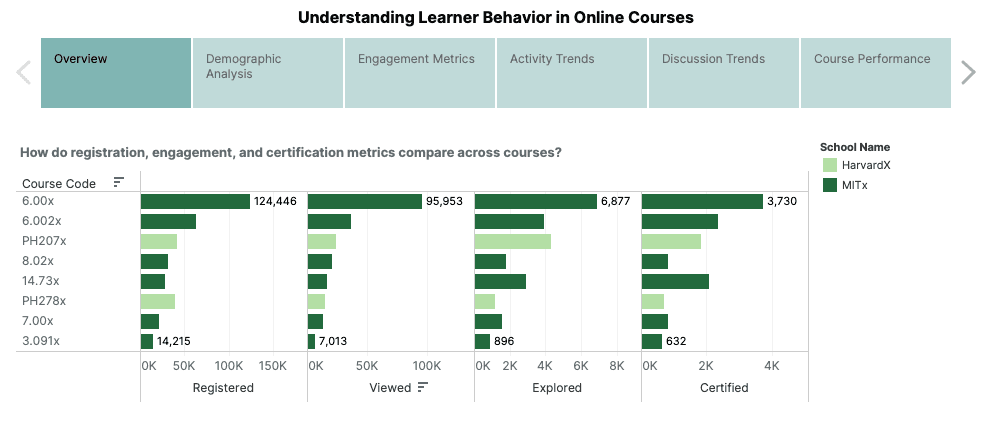
Insight — Significant Drop-Off Between Registration and Certification.

124,000 Users
97% Registered
3730 Users
3% Certified
The analysis of registration, viewing, exploring, and certification stages revealed a stark decline at each step. This trend was consistent across multiple courses, underscoring a persistent challenge in retaining learners.
Insight — Positive Correlation Between Engagement and Certification Success.

Engagement Index
40.66 Pts
Certification Rate
2.34%
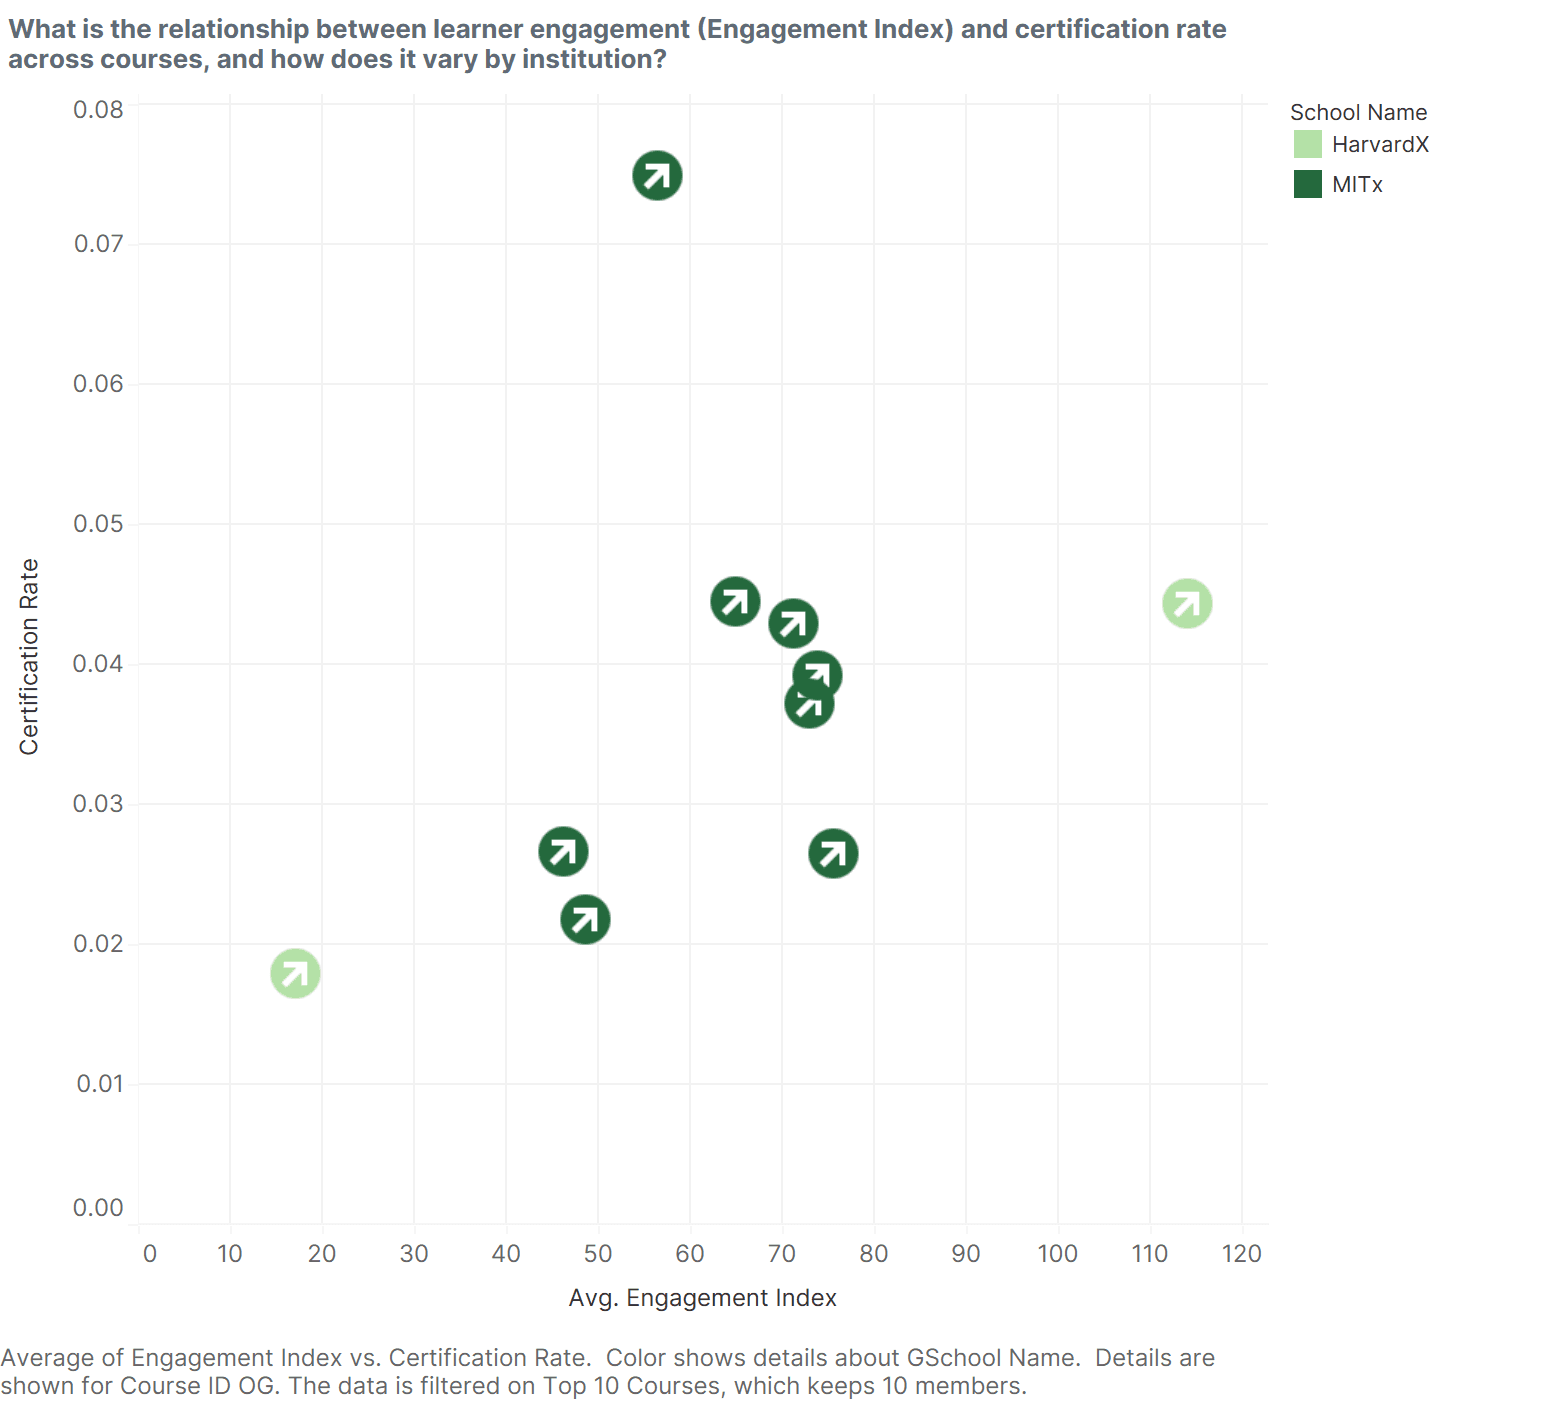
A scatter plot of the Engagement Index (measuring active participation) against certification rates revealed a clear positive correlation. A difference of 40.66 points, with higher engagement leading to better outcomes and a 2.34% higher certification rate in courses with greater engagement. Courses with higher levels of learner activity, such as forum posts or interactive module engagement, consistently showed better certification outcomes.
Insight — Course Performance and Variability in Grades.

HarvardX Variability
10.8
MITx Variability
1.5
HarvardX Avg. Grades
85.1
MITx Avg. Grades
85.5
A box plot analysis highlighted variability in final grades across HarvardX and MITx courses. MITx courses demonstrated consistent performance with lower grade variability, while HarvardX courses exhibited a wider range, including outliers with exceptionally high grades.
Visualizing Data for Student Engagement Metrics
02
I sought to enhance online learning by uncovering insights through data analysis and crafting impactful visualizations.
How might I analyze 'Student Engagement Metrics' to understand Learning Behavior?
My focus was on making the findings accessible and actionable for educators, administrators, and instructional designers by exploring the dataset, cleaning and optimizing the data, and designing compelling visualizations.
Clean & Prepare
Raw dataset included over 641,000 records and 21 columns.
Cleaned missing values, dropped redundant variables, created calculated fields.
Analyze & Question
Generated Questions to explore the data set.
Using Tableau, I explored trends in learner behavior.
Tell a Story
Crafted dashboards to present insights and findings.
Recommended gamification and active learning to improve engagement and completion rates.
Visualizing Data for Student Engagement Metrics
03
Hands-On Interactivity will greatly improve online learning and student engagement.
Significant Drop-Off Between Registration and Certification
Course designers can introduce gamification elements to keep learners motivated to reduce drop-off rates.
Positive Correlation Between Engagement and Certification Success
Teachers can implement active learning techniques to increase engagement and certification rates.
Course Performance and Variability in Grades
For HarvardX, focus on analyzing outlier courses and for MITx experimenting with course elements could enhance outcomes.
Visualizing Data for Student Engagement Metrics
04
What did I learn?
This project taught me the value of combining data analysis with design to tell impactful stories.
I realized the importance of understanding the audience—educators and course designers—and tailoring insights to their needs.
Additionally, I deepened my skills in data visualization and storytelling, key tools for creating meaningful learning experiences.
Visualizing Data for Student Engagement Metrics
05
Last Update: 01.06.25 © Sanskriti Bhatnagar 2025
Back to Top
